
Overview
The Los Angeles (L.A.) abrasion test (Figure 1) is a common test method used to indicate aggregate toughness and abrasion characteristics. Aggregate abrasion characteristics are important because the constituent aggregate in HMA must resist crushing, degradation and disintegration in order to produce a high quality HMA.
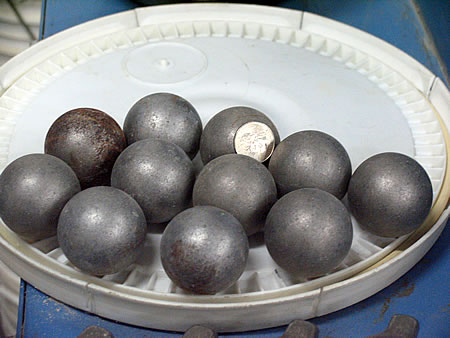
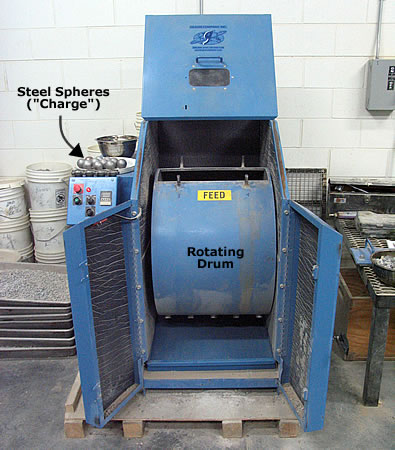
The standard L.A. abrasion test subjects a coarse aggregate sample (retained on the No. 12 (1.70 mm) sieve) to abrasion, impact, and grinding in a rotating steel drum containing a specified number of steel spheres.
After being subjected to the rotating drum, the weight of aggregate that is retained on a No. 12 (1.70 mm) sieve is subtracted from the original weight to obtain a percentage of the total aggregate weight that has broken down and passed through the No. 12 (1.70 mm) sieve. Therefore, an L.A. abrasion loss value of 40 indicates that 40% of the original sample passed through the No. 12 (1.70 mm) sieve.
The standard Los Angeles abrasion test is:
- AASHTO T 96 or ASTM C 131: Resistance to Degradation of Small-Size Coarse Aggregate by Abrasion and Impact in the Los Angeles Machine
Background
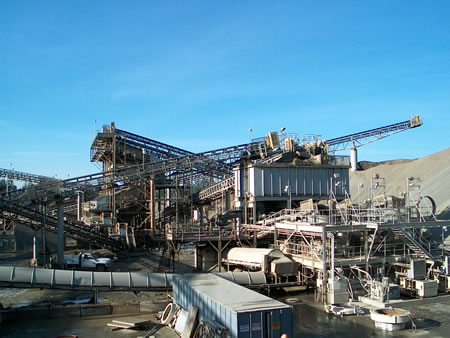
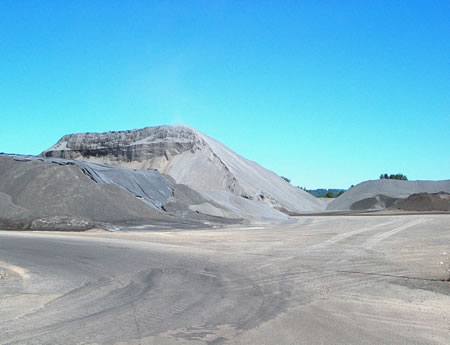
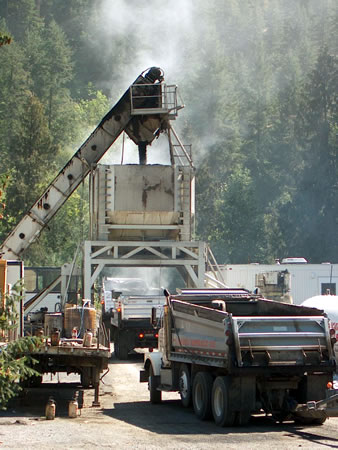
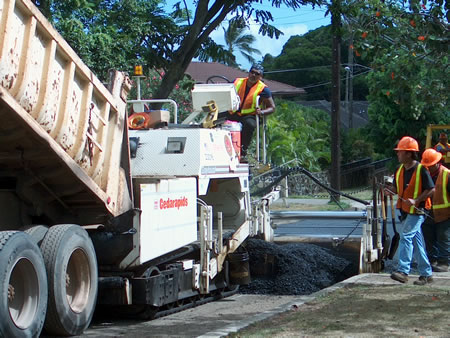
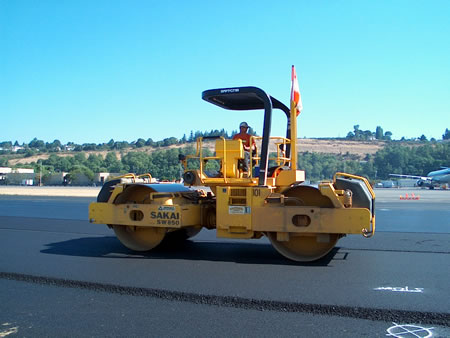
Aggregates undergo substantial wear and tear throughout their life. In general, they should be hard and tough enough to resist crushing, degradation and disintegration from any associated activities including manufacturing (Figure 2), stockpiling (Figure 3), production (Figure 4), placing (Figure 5) and compaction (Figure 6) (Roberts et al., 1996[1]). Furthermore, they must be able to adequately transmit loads from the pavement surface to the underlying layers and eventually the subgrade. These properties are especially critical for open or gap graded HMA, which do not benefit from the cushioning effect of the fine aggregate and where coarse particles are subjected to high contact stresses (Wu et al., 1998[2]). Aggregates not adequately resistant to abrasion and polishing may cause premature structural failure and/or a loss of skid resistance. Furthermore, poor resistance to abrasion can produce excessive dust during HMA production resulting in possible environmental problems as well as mixture control problems.
|
|
|
|
|
|
Because of the preceding issues, a test to predict aggregate toughness and abrasion resistance is valuable. The L.A. abrasion test is the predominant test in the U.S.; it is used by 47 States (Wu et al., 1998[2]).
Test Concept
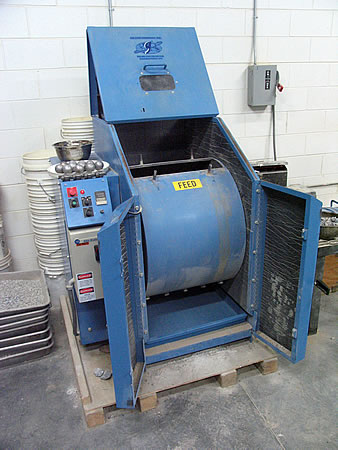
The L.A. abrasion test measures the degradation of a coarse aggregate sample that is placed in a rotating drum with steel spheres (Figure 7). As the drum rotates the aggregate degrades by abrasion and impact with other aggregate particles and the steel spheres (called the “charge”). Once the test is complete, the calculated mass of aggregate that has broken apart to smaller sizes is expressed as a percentage of the total mass of aggregate. Therefore, lower L.A. abrasion loss values indicate aggregate that is tougher and more resistant to abrasion.
Test Adequacy
The L.A. Abrasion test is an empirical test; it is not directly related to field performance of aggregates. Field observations generally do not show a good relationship between L.A. abrasion values and field performance. Wu et al. (1998[2]) found that L.A. abrasion loss was unable to predict field performance. Specifically, the test may not be satisfactory for some types of aggregates. Some aggregates, such as slag and some limestones, tend to have high L.A. abrasion loss but perform adequately in the field. L.A. abrasion loss seems to be reasonable well correlated with dust formation during handling and HMA production in that aggregates with higher L.A. abrasion loss values typically generate more of dust.
Micro-Deval Test: an Alternative to L.A. Abrasion
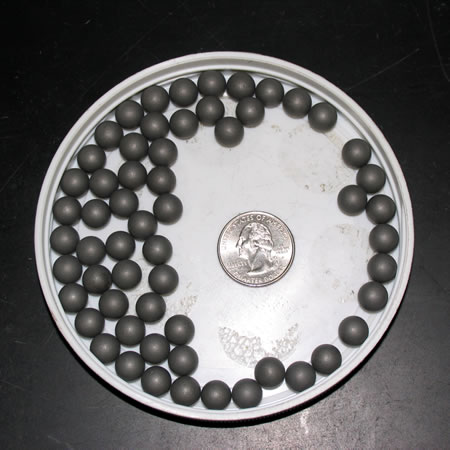
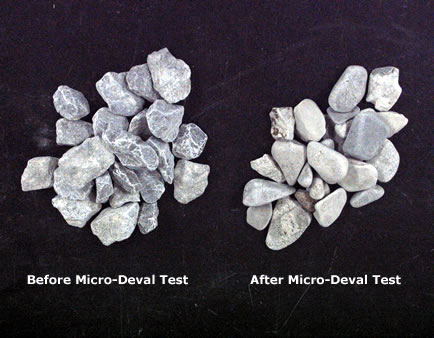
Wu et al. (1998[2]) found the Micro-Deval apparatus to be the only commonly used test that had adequate predictive abilities concerning toughness and abrasion resistance. The Micro-Deval also uses a rotating drum (Figure 8) with steel spheres but the drum is much smaller as are the spheres (Figure 9). The result is that the Micro-Deval test tends to polish (smoothen) aggregate particles (Figure 10) while the L.A. abrasion test tends to break them. Video 1 shows a Micro-Deval test in progress.
|
|
|
|
Video 1: Micro-Deval test.
The standard Micro-Deval test is:
- AASHTO TP 58: Resistance of Coarse Aggregate to Degradation by Abrasion in the Micro-Deval Apparatus
Test Description
The following description is a brief summary of the L.A. abrasion test. It is not a complete procedure and should not used to perform the test. The complete testing procedure can be found in:
- AASHTO T 96 or ASTM C 131: Resistance to Degradation of Small-Size Coarse Aggregate by Abrasion and Impact in the Los Angeles Machine
Summary
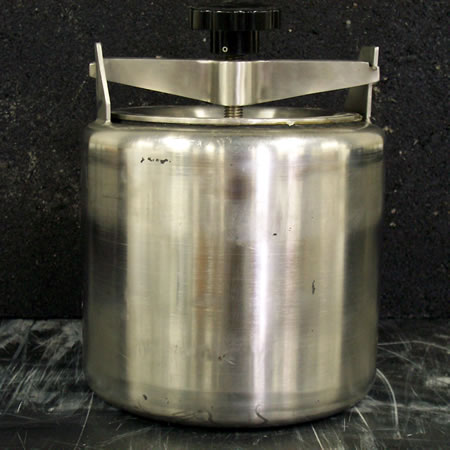
A sample of aggregate retained on the No. 12 (1.70 mm) sieve is placed inside a rotating steel drum containing a specified number of steel spheres or “charge”. As the drum rotates, a shelf inside the drum picks up the aggregate and steel spheres. The shelf carries them around until they drop on the opposite side of the drum, subjecting the aggregate to impact and crushing. Then, the aggregate is subjected to abrasion and grinding as the drum continues to rotate until the shelf picks up the contents, and the process is repeated. The drum is rotated for a specified number of revolutions. Afterward, the aggregate is removed from the drum and sieved on a No. 12 (1.70 mm) sieve. The aggregate retained on the sieve is weighed and the difference between this weight and the original weight is expressed as a percentage and reported as the L.A. abrasion loss value. Figure 11 shows major equipment used in the L.A. abrasion test.
Approximate Test Time
3 days from aggregate sampling to final weight determination. A breakdown of testing time follows:
| Reducing a sample to testing size | 5 – 10 minutes |
| Washing the sample | 5 – 10 minutes |
| Drying to a constant mass | 8 – 12 hours (overnight) |
| Time in rotating drum | 15 minutes |
| Sieving and rewashing | 30 minutes |
| Drying to a constant mass | 8 – 12 hours (overnight) |
| Final weighing | 5 – 10 minutes |
Basic Procedure
-
- Obtain the aggregate sample to be tested, and reduce the sample to adequate size (Figure 12).
Figure 12: Splitting an aggregate sample for the L.A. abrasion test. - Wash the sample and oven dry to a constant mass at 230ºF (110ºC).
- After drying, sieve the material into individual size fractions, and recombine to one of four specified gradings that most nearly represents the aggregate gradation as received. Record the total sample mass. The total sample mass should be about 5000 g.
- Place the sample and the specified number of steel spheres into the drum and rotate for 500 revolutions at 30 to 33 rev/min (Video 2). The charge required is dependent upon the grading used.
- Obtain the aggregate sample to be tested, and reduce the sample to adequate size (Figure 12).

Video 2: LA abrasion test.
- Discharge the material and sieve the aggregate over a sieve coarser than a 1.70-mm (No. 12) sieve (Figure 13).
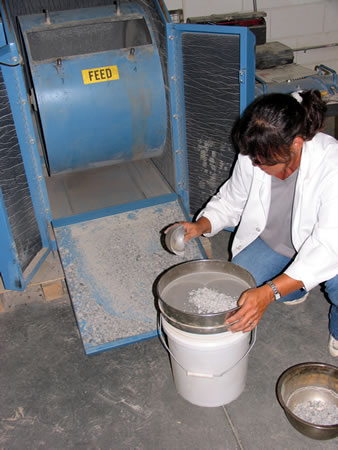
Figure 13: Sieving the sample after the L.A. abrasion test. - Sieve the finer material on a No. 12 (1.70 mm) sieve.
- Wash the aggregate coarser than the No. 12 (1.70 mm) sieve and oven-dry to a constant mass at 230ºF (110ºC). After cooling, determine the mass.

Results
Parameters Measured
L.A. abrasion loss as a percentage by weight.
Specifications
Table 1: Source Property L.A. Abrasion Specifications
| Material | Value | Specification | HMA Distress of Concern |
|---|---|---|---|
| Coarse Aggregate | % Loss | Varies1 | Deformation, skid resistance |
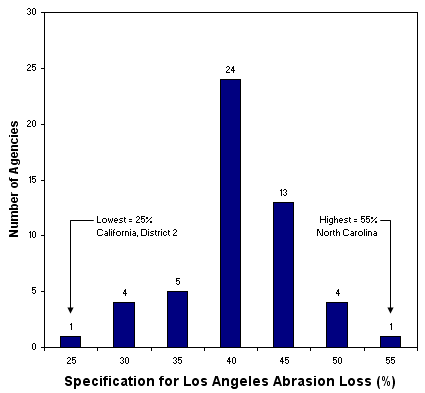
Note 1 There is no standard L.A. abrasion specification for Superpave mix design; specifications are typically established by state or local agencies. Typically U.S. state specifications limit the abrasion of coarse aggregate for HMA use to a maximum ranging from 25 to 55 percent, with most states using a specification of 40 or 45 percent (Figure 14). Requirements for Portland Cement Concrete (PCC) tend to be similar, while requirements for specialized mixes such as Stone Matrix Asphalt (SMA) tend to be lower; AASHTO specifies a maximum L.A. abrasion loss of 30 percent for SMA.
Typical Values
Typical L.A. abrasion values are shown in Table 2.
Table 2: Typical L.A. Abrasion Loss Values
| Rock Type | L.A. Abrasion Loss (by percent weight) |
|---|---|
| General Values | |
| Hard, igneous rocks | 10 |
| Soft limestones and sandstones | 60 |
| Ranges for specific rocks | |
| Basalt | 10 – 17 |
| Dolomite | 18 – 30 |
| Gneiss | 33 – 57 |
| Granite | 27 – 49 |
| Limestone | 19 – 30 |
| Quartzite | 20 – 35 |
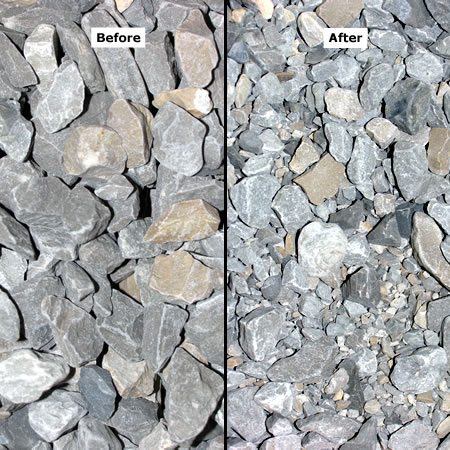
Figure 15 shows typical before and after L.A. abrasion aggregate samples.
Calculations (Interactive Equation)
Determine the percent loss as a percentage of the original sample mass.
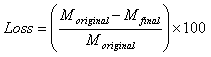
Where:
Moriginal = original sample mass (g)
Mfinal = final sample mass (g)
Report this value as the percent loss.
- Roberts, F.L.; Kandhal, P.S.; Brown, E.R.; Lee, D.Y. and Kennedy, T.W. (1996). Hot Mix Asphalt Materials, Mixture Design, and Construction. National Asphalt Pavement Association Education Foundation. Lanham, MD.↵
- Wu, Y.; Parker, F. and Kandhal, K. (1998). Aggregate Toughness/Abrasion Resistance and Durability/Soundness Tests Related to Asphalt Concrete Performance in Pavements. NCAT Report 98-4. National Center for Asphalt Technology. Auburn, AL. http://www.eng.auburn.edu/center/ncat/reports/rep98-4.pdf. Accessed 23 June 2004.↵