Overview
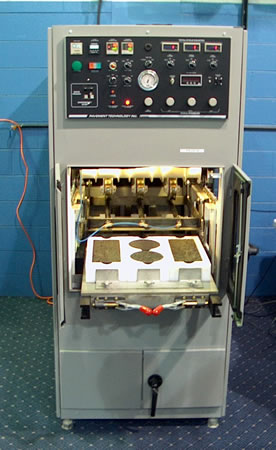
Laboratory wheel-tracking devices (Figure 1) are used to run simulative tests that measure HMA qualities by rolling a small loaded wheel device repeatedly across a prepared HMA specimen. Performance of the test specimen is then correlated to actual in-service pavement performance. Laboratory wheel-tracking devices can be used to make rutting, fatigue, moisture susceptibility and stripping predictions. Some of these devices are relatively new and some have been used for upwards of 15 years like the French Rutting Tester (FRT).
In general, these wheel tracking devices have potential for rut and other measurements but the individual user must be careful to establish laboratory conditions (e.g., load, number of wheel passes, temperature) that produce consistent and accurate correlations with field performance.
There are several different types of wheel-tracking devices; the three most prominent devices will be covered in the Background section, while the basic procedure for the Asphalt Pavement Analyzer (APA) rut test is discussed in the Test Description section.
The standard APA test is:
- AASHTO TP 63: Determining Rutting Susceptibility of Asphalt Paving Mixtures Using the Asphalt Pavement Analyzer (APA) Determining Rutting Susceptibility of Asphalt Paving Mixtures Using the Asphalt Pavement Analyzer (APA)
Background
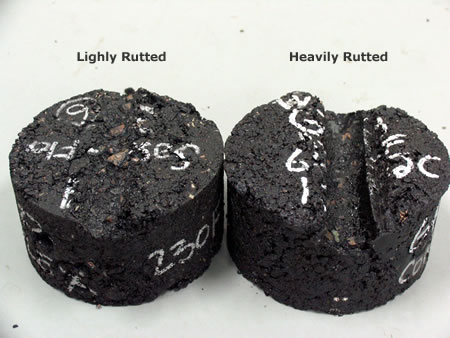
The more popular laboratory wheel tracking devices in the U.S. are generally recognized, in order of decreasing popularity, as the Asphalt Pavement Analyzer (APA), Hamburg Wheel Tracking Device (HWTD) and French Rutting Tester (FRT). These devices are all capable of proof testing HMA mixtures (i.e., providing a pass-fail test based on rutting potential, Figure 2) and can be reasonably well correlated to field rut performance. However, none should be relied on to predict field rut depths for specific projects based on laboratory wheel tracking rut depth relationships developed on other projects with different geographical locations and traffic. Additionally, due to the complex stress state of the samples, these tests cannot be used for mechanistic pavement design input.
This section, taken largely from Cooley et al. (2000[1]) and Kandhal and Cooley (2003[2]), provides a brief overview of the Asphalt Pavement Analyzer (APA), Hamburg Wheel Tracking Device (HWTD) and the French Rutting Tester (FRT).
Asphalt Pavement Analyzer (Figure 3)
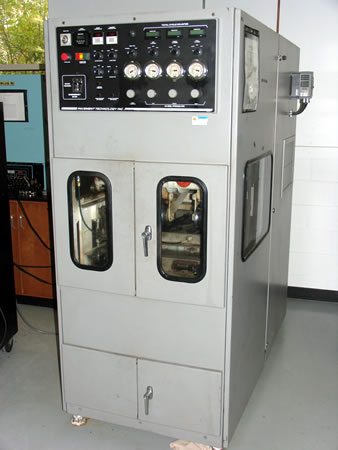
The Asphalt Pavement Analyzer (APA) is a second generation device that was originally developed in the mid 1980s as the Georgia Loaded Wheel Tester; a device designed for rut proof testing and field quality control.
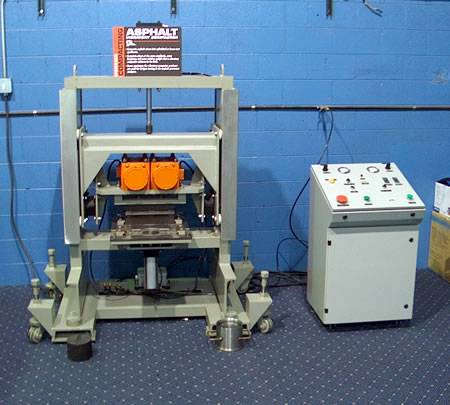
The APA tracks a loaded aluminum wheel back and forth across a pressurized linear hose over a HMA sample (Video 1). Although the APA can be used for a number of tests, it is typically used to measure and predict rutting. Most commonly, the wheel is tracked across the sample for 8,000 cycles using a 100 lb (445 N) load and a 100 psi (690 kPa) hose pressure. Test samples can be in the form of beams or cylinders. Beams are typically compacted with the asphalt vibratory compactor (Figure 4), while cylinder samples are typically compacted with the SGC.
Video 1: APA operation (doors open for demonstration viewing only).
Kandhal and Cooley’s NCHRP Report 508: Accelerated Laboratory Rutting Tests: Evaluation of the Asphalt Pavement Analyzer (2003[2]) concludes the following about the APA:
- Sample compaction. Cylindrical samples compacted to 4-percent air voids and beam samples compacted to 5-percent air voids resulted in APA laboratory test results that were more closely related to field rutting performance than did cylindrical and beam samples compacted to 7-percent air voids.
- Test temperature.
- Test temperature significantly affects measured rut depths in the APA. As test temperature increases, APA rut depths increase.
- Samples tested at a test temperature corresponding to the high temperature PG specification better predicted field rutting performance than did samples tested at 6°C higher.
- Hose diameter.
- Samples tested with both the standard- and large-diameter hoses predicted field rutting performance about equally well. However, samples tested with the standard hose produced less variability.
- APA-measured rut depths were collectively higher with the standard-diameter hose than with the larger diameter hose.
- Field rutting prediction. Based on limited data, the APA compared well with other performance tests with respect to predicting the potential for rutting in the field. However, it is generally not possible to predict field rut depths from APA rut depths on a specific project using relationships developed on other projects with different geographical locations and traffic.
- Beam and cylindrical samples predicted field rutting performance about equally well.
- Laboratory rut depths measured by the APA had good correlations on an individual project basis with the field rut depths in the case of FHWA ALF, WesTrack, MnRoad, and I-80 (Nevada) projects. However, the APA-measured rut depths had a poor correlation with field rut depths in the case of 10 test sections on the NCAT Test Track, which did not develop any significant rutting after 2 years of loading.
Hamburg Wheel Tracking Device (Figure 5)
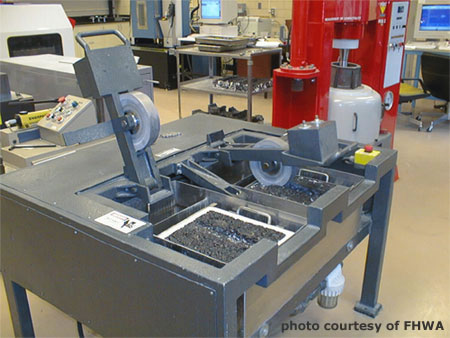
The Hamburg Wheel Tracking Device (HWTD), developed in Germany, can be used to evaluate rutting and stripping potential. The HWTD tracks a loaded steel wheel back and forth directly on a HMA sample. Tests are typically conducted on 10.2 x 12.6 x 1.6 inch (260 x 320 x 40 mm) slabs (although the test can be modified to use SGC compacted samples) compacted to 7 percent air voids with a linear kneading compactor. Most commonly, the 1.85 inch (47 mm) wide wheel is tracked across a submerged (underwater) sample for 20,000 cycles (or until 20 mm of deformation occurs) using a 158 lb (705 N) load. Rut depth is measured continuously with a series of LVDTs on the sample. Several modified HWTDs have been produced in the U.S. with the principal modifications being loading force or wheel type.
Data Evaluation
Figure 6 shows a typical plot from a HWTD test and the key plot parameters. The following parameters are measured and reported:
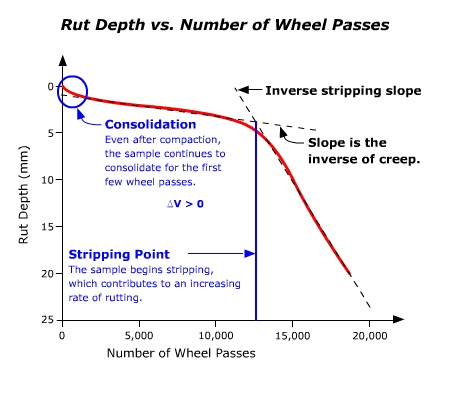
- Post-compaction consolidation. The rut depth at 1,000 load cycles is assumed due to continued consolidation.
- Creep slope. The inverse of the rutting slope after post-compaction consolidation but before the stripping inflection point. Creep slope is used to evaluate rutting potential instead of rut depth because the number of load cycles at which moisture damage begins to affect rut depth varies between HMA mixtures and cannot be conclusively determined from the plot.
- Stripping inflection point. The point at which the creep slope and stripping slope intercept. This can be used to evaluate moisture damage potential. If the stripping inflection point occurs at a low number of load cycles (e.g., less than 10,000), the HMA mixture may be susceptible to moisture damage.
- Stripping slope. A measure of the accumulation of moisture damage. As with flow time and flow number, this portion of the plot may contain tertiary flow as well, however it is not possible to separate out moisture damage from tertiary viscous flow.
The HWTD has been found to have excellent correlation with field performance (especially in moisture damage evaluation) (Aschenbrener, 1995[4]; Izzo and Tahmoressi, 1999[5]; Williams and Prowell, 1999[6]) however, it can fail to differentiate between some mixtures (Zhou et al., 2003[7]). The FHWA has a good concise description of the HWTD at:
http://www.tfhrc.gov/pavement/asphalt/labs/mixtures/hamburg.htm.
French Rutting Tester (Figure 7)
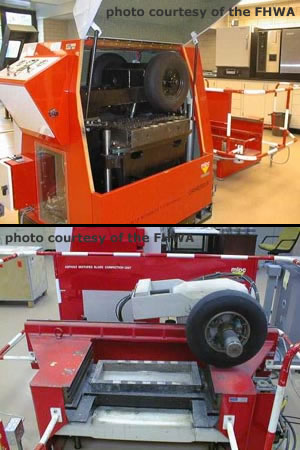
The Laboratoire Central des Ponts et Chaussées (LCPC) wheel tracker, also known as French Rutting Tester (FRT), has been used in France for over 15 years to evaluate HMA rutting characteristics (Cooley et al., 2000[1]).
The FRT tracks a loaded pneumatic tire back and forth across a HMA sample. Tests are typically conducted on 7.1 x 19.7 x 0.8-3.9 inch (180 x 50 x 20-100 mm) slabs compacted with a plate compactor (Figure 7). Most commonly, the tire is tracked across a sample for 30,000 cycles using a 1124 lb (500 N) load applied to a pneumatic tire inflated to 87 psi (600 kPa) (Cooley et al., 2000[1]). Aschenbrener (1992[8]) showed that the FRT can be used to differentiate between good and poor field rut performance in the U.S. The FHWA has a good concise description of the FRT at: www.tfhrc.gov/pavement/asphalt/labs/mixtures/frenchr.htm.
LCPC has a short video of the FRT at: www.lcpc.fr/en/produits/materiels_mlpc/fiche.dml?id=123&type=abcdaire.
The FRT is reportedly not valid for HMA mixtures with NMAS greater than 0.8 inches (20 mm). The slab width is relatively small compared to the tire width and mixtures with aggregates greater than 0.8 inches (20 mm) may be inhibited from shearing outward and upward. Aggregates larger than 0.8 inches (20 mm) may also wear the tires severely, and often cannot be compacted properly using the French Plate Compactor (FHWA, 2002[9]).
Test Description
The following is a brief summary of the test. It is not a complete procedure and should not be used to perform the test. The complete test procedure can be found in::
- AASHTO TP 63: Determining Rutting Susceptibility of Asphalt Paving Mixtures Using the Asphalt Pavement Analyzer (APA) Determining Rutting Susceptibility of Asphalt Paving Mixtures Using the Asphalt Pavement Analyzer (APA)
Summary
Three sets of HMA samples are loaded into the temperature controlled chamber of the APA. Gauge readings are taken initially and then again after 8,000 load cycles. The difference between the two readings is the rutting induced by the APA. An average of all samples in the APA (6 cylindrical or 3 beam) is reported as the average APA rut depth. Figure 1 shows the APA with samples pulled out.
Approximate Test Time
An 8,000 cycle test takes about 8.5 hours (6 hours to preheat the samples plus about 2.5 hours for the 8,000 cycle test and rut measurements). Creation and preparation of the samples can take upwards of several days depending upon conditioning times.
Basic Procedure
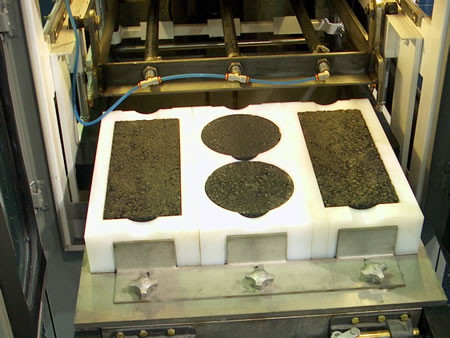
- Prepare either 6 cylindrical or 3 beam test samples (Figure 8). Laboratory compacted cylindrical samples should be compacted to 4 percent air voids and be 3 inches (75 mm) tall. Laboratory compacted beam samples should be compacted to 5 percent air voids and be 3 inches (75 mm) tall. Field core samples should have a 6 inch (150 mm) diameter and either be 3 inches (75 mm) tall or be augmented with plaster-of-paris to produce a 3 inch (75 mm) tall sample.
- Determine the bulk specific gravity (Gmb), maximum specific gravity (Gmm) and air void content (Va) of each sample.
- Set the test temperature at the high temperature specification of the PG binder used.
- Preheat the samples in the APA or a calibrated oven for 6 hours.
- Set the hose pressure and load cylinder pressure to the desired levels. Typically, 120 psi (827 kPa) is used for the hose and 120 lb (534 N) is used for the load.
- Stabilize the test chamber at the desired temperature.
- Insert the test samples into the chamber.
- Apply 25 cycles to seat the samples.
- Open the chamber doors, unlock and unseat the sample, and place the rut depth measurement template over the sample.
- Zero the gauge and take initial rut depth readings. Repeat this step for each set of cylinders of beams in the APA.
- Push the sample holding tray in, close the APA doors and allow 10 minutes for the test temperature to stabilize.
- Set the APA counter to 8,000 cycles.
- Start the APA loading.
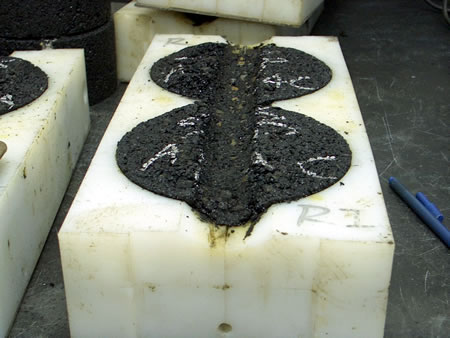
- At the end of 8,000 cycles, repeat step 10 to get the final rut depth measurement (Figure 9).
Results
Parameters Measured
Rutting, fatigue cracking and moisture susceptibility. Rutting prediction is the most frequent use and will be presented in this section.
Specifications
Superpave mix design does not have an APA rutting specification. Typically, state and local agencies develop their own specifications based on pavement location, traffic and environment.
Hamburg Wheel Tracking Device Example Specifications
The Colorado DOT recommends a maximum rut depth at 10,000 load cycles of 4 mm and 10 mm at 20,000 load cycles. The City of Hamburg, Germany uses a maximum allowable rut depth of 4 mm at 19,200 load cycles (FHWA, 2003[10]).
Typical Values
Laboratory rut depths are highly dependent on HMA mixture composition, testing temperature, hose size and applied load. Typical values can range from 0.2 to 0.8 inches (5 to 20 mm) after 8,000 loading cycles (Figure 9).
Calculations
For rutting, the initial gauge reading is subtracted from the final reading to get the APA induced rutting.
- Cooley, L.A.; Kandhal, P.S.; Buchanan, M.S.; Fee, F. and Epps, A. (2000). Loaded Wheel Testers in the United States: State of the Practice. NCAT Report No. 2000-4. National Center for Asphalt Technology. Auburn, AL.↵
- Kandhal, P.S. and Cooley, L.A. (2003). NCHRP Report 508: Accelerated Laboratory Rutting Tests: Evaluation of the Asphalt Pavement Analyzer. Transportation Research Board, National Research Council. Washington, D.C. http://trb.org/news/blurb_detail.asp?id=2169. Accessed December 2004.↵
- Stuart, K.D. and Youtcheff, J.S. (2001). Understanding the Performance of Modified Asphalt Binders in Mixtures: Evaluation of Moisture Sensitivity. Report No. FHWA-RD-02-029. Federal Highway Administration. Washington, D.C. http://www.tfhrc.gov/pavement/asphalt/pavepubs/02029. Accessed December 2004.↵
- Aschenbrener, T. (1995). Evalulation of Hamburg Wheel-Tracking Device to Predict Moisture Damage in Hot Mix-Asphalt. Transportation Research Record 1492. Transportation Research Board, National Research Council, Washington, D.C. pp. 193-201.↵
- Izzo, R.P. and Tahmoressi, M. (1999). Use of Hamburg Wheel-Tracking Device for Evaluating Moisture Susceptibility of Hot-Mix Asphalt.Transportation Research Record 1681 . Transportation Research Board, National Research Council, Washington, D.C. pp. 76-85.↵
- Williams, R.C. and Prowell, B.D. (1999). Comparison of Laboratory Wheel-Tracking Test Results with WesTrack Performance. Transportation Research Record 1681. Transportation Research Board, National Research Council, Washington, D.C. pp. 121-128.↵
- Zhou, F.; Chen, D.H.; Scullion, T. and Bilyeu, J. (2003). Case Study: Evaluation of Laboratory Test Methods to Characterize Permanent Deformation Properties of Asphalt Mixes. International Journal of Pavement Engineering, Vol. 4, No. 3. pp. 155-164.↵
- Aschenbrener, T. (1992). Comparison of Results Obtained from the French Rutting Tester with Pavements of Known Field Performance. Report No. CDOT-DTD-R-92-11, Colorado DOT.↵
- Federal Highway Administration (FHWA). (2002). Turner-Fairbanks Highway Research Center Bituminous Mixtures Laboratory (BLM) Equipment web page. http://www.tfhrc.gov/pavement/asphalt/labs/mixtures/bmlequip.htm. Accessed December 2004.↵
- Federal Highway Administration (FHWA). (2003). Federal Highway Administration Administrators.http://www.fhwa.dot.gov/administrators/index.htm. Accessed 22 July 2004.↵
