
The Asphalt Institute’s component analysis design approach (termed “effective thickness” by the Asphalt Institute) uses relationships between subgrade strength, pavement structure, and traffic (Asphalt Institute, 1983). The existing structural integrity of the pavement is converted to an equivalent thickness of HMA, which is then compared to that required for a new design. The structural evaluation procedure developed by the Asphalt Institute allows for either determining the required thickness of asphalt concrete overlay or estimating the length of time until an overlay is required. The essential parts of this overlay design procedure will be briefly described:
- Subgrade analysis
- Pavement structure thickness analysis
- Traffic analysis
This section summarizes the approach described in the Asphalt Institute’s Asphalt Overlays for Highway and Street Rehabilitation (MS-17).
Subgrade Analysis
Subgrade material testing is encouraged even if original design records are available. The resilient modulus (MR), CBR or R-value tests appear to be the easiest to use with this procedure. For actual design, the design strength of the subgrade must be characterized in terms of resilient modulus. Therefore CBR and R-values must be correlated to resilient modulus values. If test data in terms of MR, CBR, or R-value are not available, subgrades can be placed into one of three classes for design purposes as follows:
- Poor soils. Soft and plastic when wet, generally composed of silts or clays. Typical properties are: MR = 30 MPa (4,500 psi), CBR = 3, R-value = 6.
- Medium soils. Include soils such as loams, silty sands, and sand-gravels which contain moderate amounts of clay and silt. These soils can be expected to lose only a moderate amount of strength when wet. Typical properties are: MR = 80 MPa (12,000 psi), CBR = 8, R-value = 20.
- Good soils. These soils can be expected to retain a substantial amount of their strength when wet and include clean sands and sand-gravels. Typical properties: MR = 170 MPa (25,000 psi), CBR = 17, R-value = 43.
If subgrade strength or stiffness test results are available, a conservative value is chosen as a function of the design traffic (ESALs). To do this, a plot is prepared of the percent equal to or greater than (y-axis) versus subgrade strength/stiffness test results (x-axis). Basically, this is a cumulative frequency plot. The design subgrade strength/stiffness is then selected from the plot according to Table 1 or similar criteria.
Example Plot Using CBR Values
Table 1: Design Subgrade Resilient Modulus Selection Values
| Design ESALs | Design Subgrade Percentile Value (%) |
|---|---|
| ≤10,000 | 60 |
| 10,000 to 1,000,000 | 75 |
| > 1,000,000 | 87.5 |
Pavement Structure Analysis
The goal of this portion of the design method is to determine the “Effective Thickness (Te)” of the existing pavement structure. AASHTO refers to effective thickness as Deff. One common Asphalt Institute approach is illustrated here. First, the significant pavement layers are identified and their condition determined. Second, “Conversion Factors” are selected for each layer (judgment by the designer is very important at this point). Third, the Effective Thickness for each layer is determined by multiplying the actual layer thickness by the appropriate Conversion Factor. The Effective Thickness of the complete pavement structure is the sum of the individual Effective Thicknesses. Typical layer thickness Conversion Factors are shown in Table 2.
Table 2: Example of Asphalt Institute Conversion Factors for Estimating Thickness of Existing Pavement Components to Effective Thickness (after Asphalt Institute, 1983)
| Description of Layer Material | Conversion Factor* |
|---|---|
| Native subgrade | 0.0 |
| Improved subgrade - predominantly granular material | 0.0 |
| Lime modified subgrade of high PI soils | |
| Granular subbase or base CBR not less than 20 | 0.1 - 0.3 |
| Cement modified subbases and bases constructed from low PI soils | |
| Cement or lime-fly ash bases with pattern cracking | 0.3 - 0.5 |
| Emulsified or cutback asphalt surfaces and bases with extensive cracking, rutting, etc. | |
| PCC pavement broken into small pieces | |
| Asphalt concrete surface and base that exhibit extensive cracking | 0.5 - 0.7 |
| Asphalt concrete generally uncracked | 0.9 - 1.0 |
| PCC pavement stable, undersealed and generally uncracked pavement | |
| *Equivalent thickness of new asphalt concrete |
Traffic Analysis
The Asphalt Institute treatment of traffic includes consideration of volume composition, and axle weights, with the goal being to develop the equivalent number of ESALs. To estimate the ESALs for the overlay design period, at least two approaches can be used, depending on availability of site specific traffic information. One approach provides broad traffic classifications and the associated ESAL amounts, as illustrated in Table 3. The second approach includes the use of “truck factors” (the average ESALs per truck number) along with the number and type of trucks that are expected to use the facility.
This approach can accommodate a wide variety of truck information ranging from only an estimate of the percent of the Average Daily Traffic (ADT) that constitutes trucks to estimates of trucks broken into the categories of single and multi-units (as illustrated by “vehicle type” in Table 3).
Truck factors are shown in Table 7.3 for a variety of vehicle types, with the average being 0.4 ESAL per truck averaged over all highway and truck types. Thus, if a given “average” highway is expected to have 1,000,000 trucks during the design period, the resulting ESALs would be 400,000.
Table 3: Asphalt Institute Traffic Classifications (after Asphalt Institute, 1983)
| Type of Street or Highway Estimated | 18,000 lb (80 kN) ESALs |
|---|---|
| Parking lots, light traffic residential streets and farm roads | 5,000 |
| Residential streets, rural farm and residential roads | 10,000 |
| Urban and rural minor collectors | 100,000 |
| Urban minor arterials, light industrial streets, rural major collectors and rural minor arterial highways | 1,000,000 |
| Urban/rural freeways and other principal arterial highways | 3,000,000 |
| Some interstate highways and industrial roads | 10,000,000 |
Table 4. Average Truck Factors Compiled from FHWA Data (after Asphalt Institute, 1983)
| Vehicle Types | Truck Factors | ||||
| Rural Highways | Urban Highways | Combined | |||
| Interstate | Other | All | |||
| 1. Single-units | |||||
| (a) 2-axle, 4-tire | 0.02 | 0.02 | 0.03 | 0.03 | |
| (b) 2-axle, 6-tire | 0.19 | 0.21 | 0.20 | 0.26 | |
| (c) 3-axles or more | 0.56 | 0.73 | 0.67 | 1.03 | |
| (d) All single-units | 0.07 | 0.07 | 0.07 | 0.09 | |
| 2. Tractor semi-trailers | |||||
| (a) 3-axle | 0.51 | 0.47 | 0.48 | 0.47 | |
| (b) 4-axle | 0.62 | 0.83 | 0.70 | 0.89 | |
| (c) 5-axles or more | 0.94 | 0.98 | 0.95 | 1.02 | |
| (d) All multiple units | 0.93 | 0.97 | 0.94 | 1.00 | |
| 3. All trucks | 0.49 | 0.31 | 0.42 | 0.30 | |
- Traffic
- Average Daily Traffic = 4,000
- Percent trucks (total all units) = 10%
- Traffic growth rate = 4%
- Existing pavement structure and condition
- Asphalt concrete = 3 in.
- Crushed stone base = 8 in.
- Subgrade design strength value: CBR = 8 or MR » 12,000 psi
- Overall, the pavement structure is in poor condition, with the HMA exhibiting well defined crack patterns
Determine overlay thickness for a 20-year design period.
- 80 kN (18,000 lb.) ESALs
- number of trucks in the design lane per day = (4,000)(0.50)(0.10) = 200
- ESALs/day = 200(0.4 ESAL/truck) = 80 ESALs/day
- 18K ESAL for design period = (80 ESALs/day) (365 days/yr)(29.8) » 870,000 after adjustment for design period and traffic growth rate. Note:
- Effective pavement thickness
- From Figure 1, the required new “full-depth” asphalt concrete pavement thickness (Tn) = 195 mm (7.7 in.).
- Thickness of asphalt concrete overlay = Tn – Te = 195 mm – 77.5 mm = 117.5 mm (4.6 in.)
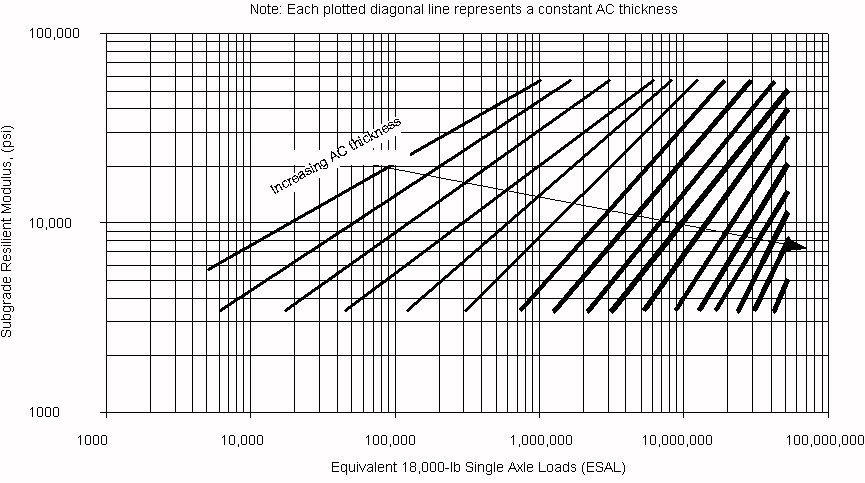
Table 4. Average Truck Factors Compiled from FHWA Data (after Asphalt Institute, 1983)
| Vehicle Types | Truck Factors | ||||
| Rural Highways | Urban Highways | Combined | |||
| Interstate | Other | All | |||
| 1. Single-units | |||||
| (a) 2-axle, 4-tire | 0.02 | 0.02 | 0.03 | 0.03 | |
| (b) 2-axle, 6-tire | 0.19 | 0.21 | 0.20 | 0.26 | |
| (c) 3-axles or more | 0.56 | 0.73 | 0.67 | 1.03 | |
| (d) All single-units | 0.07 | 0.07 | 0.07 | 0.09 | |
| 2. Tractor semi-trailers | |||||
| (a) 3-axle | 0.51 | 0.47 | 0.48 | 0.47 | |
| (b) 4-axle | 0.62 | 0.83 | 0.70 | 0.89 | |
| (c) 5-axles or more | 0.94 | 0.98 | 0.95 | 1.02 | |
| (d) All multiple units | 0.93 | 0.97 | 0.94 | 1.00 | |
| 3. All trucks | 0.49 | 0.31 | 0.42 | 0.30 | |
| Layer Thickness (inches) | Conversion Factor (Table 2) | Effective Thickness (inches) |
|---|---|---|
| 75 mm (3 in.) | 0.5 | 37.5 mm (1.5 in.) |
| 200 mm (8 in.) | 0.2 | 40.0 mm (1.6 in.) |
| Total Te equals | 77.5 mm (3.1 in.) |