
The basic concepts of the Hveem mix design method were originally developed by Francis Hveem when he was a Resident Engineer for the California Division of Highways in the late 1920s and 1930s. Currently, the Hveem method is used by several western states. The basic philosophy surrounding the Hveem method can be summarized in the following three points (Vallerga and Lovering, 1985[1]):
- HMA requires enough asphalt binder to coat each aggregate particle to an optimum film thickness (allowing for its absorption into the aggregate).
- HMA requires sufficient stability to resist traffic loading. This stability is generated by internal friction between aggregate particles and cohesion (or tensile strength) created by the binder.
- HMA durability increases with thicker asphalt binder film thicknesses.
Based on this philosophy, the design asphalt content is selected as that asphalt content resulting in the highest durability without dropping below a minimum allowable stability. In other words, as much asphalt binder as possible should be used while still meeting minimum stability requirements.
This section consists of a brief history of the Hveem mix design method followed by a general outline of the actual method. This outline emphasizes general concepts and rationale for the specific procedures. Detailed procedures can vary from state-to-state but typical procedures are available in the following documents:
- Roberts, F.L.; Kandhal, P.S.; Brown, E.R.; Lee, D.Y. and Kennedy, T.W. (1996[2]). Hot Mix Asphalt Materials, Mixture Design, and Construction. National Asphalt Pavement Association Education Foundation. Lanham, MD.
- Asphalt Institute. (1997[3]). Mix Design Methods for Asphalt, 6th ed., MS-02. Asphalt Institute. Lexington, KY.
Hveem Mix Design History
(from Vallerga and Lovering, 1985[1])
In the late 1920s, the California Division of Highways had come to use an asphalt-aggregate blend commonly known as an “oil mix” on many of their rural roads. An oil mix was a compromise between the more expensive high performance HMA used on major urban streets and highways and the cheaper low performance penetrative method (asphalt oil sprayed on a roadway surface of unbound particles) used on low-volume rural highways. An oil mix consisted of a combination of aggregate and asphaltic oil that was mixed either in a plant or on the road itself (called a “road mix”), spread by blade, then compacted by traffic. Unfortunately, there was no method available for designing these oil mixes. Based on his research, and that of others, Francis N. Hveem developed a method for determining the correct amount of oil based on aggregate surface area, which could be determined from gradation. It also became evident that even given the right oil content, roads containing aggregates with “hard, glassy surface texture” tended to deform excessively under load while roads containing aggregates with a “rough, irregular surface texture” were more stable. Therefore, Hveem worked to develop a device that would measure stability, which eventually became the Hveem Stabilometer. One more problem existed: specimens compacted in the laboratory for the Stabilometer did not produce the same readings as those taken from field cores. Therefore, a new compaction machine, which eventually became the California Kneading Compactor, was developed to more closely simulate the compaction produced by rollers in the field.
Hveem Mix Design Procedure
The Hveem mix design method consists of 6 basic steps:
- Aggregate selection.
- Asphalt binder selection.
- Sample preparation (including compaction).
- Stability determination using the Hveem Stabilometer.
- Density and voids calculations.
- Optimum asphalt binder content selection.
Standard procedures used in Hveem mix design are:
- AASHTO T 246: Resistance to Deformation and Cohesion of Bituminous Mixtures by Means of Hveem Apparatus
- AASHTO T 247: Preparation of Test Specimens of Bituminous Mixtures by Means of the California Kneading Compactor
Aggregate Selection
Although Hveem did not specifically develop an aggregate evaluation and selection procedure, one is included here because it is integral to any mix design. A typical aggregate evaluation for use with either the Hveem or Marshall mix design methods includes three basic steps (Roberts et al., 1996[2]):
- Determine aggregate physical properties. This consists of running various tests to determine properties such as:
- Determine other aggregate descriptive physical properties. If the aggregate is acceptable according to step #1, additional tests are run to fully characterize the aggregate. These tests determine:
- Perform blending calculations to achieve the mix design aggregate gradation. Often, aggregates from more than one source or stockpile are used to obtain the final aggregate gradation used in a mix design. Trial blends of these different gradations are usually calculated until an acceptable final mix design gradation is achieved. Typical considerations for a trial blend include:
- All gradation specifications must be met. Typical specifications will require the percent retained by weight on particular sieve sizes to be within a certain band.
- The gradation should not be too close to the FHWA’s 0.45 power maximum density curve. If it is, then the VMA is likely to be too low. Gradation should deviate from the FHWA’s 0.45 power maximum density curve, especially on the 2.36 mm (No. 8) sieve.
Asphalt Binder Selection
Hveem did not specifically develop an asphalt binder evaluation and selection procedure. However, each agency uses some method of determining the appropriate asphalt cement and modifiers (if used). Asphalt binder evaluation can be based on local experience, previous performance or a procedure. The most common procedure is the Superpave PG binder system. Once the binder is selected, several preliminary tests are run to determine the asphalt binder’s temperature-viscosity relationship.
Sample Preparation
The Hveem method, like other mix design methods, creates several trial aggregate-asphalt binder blends, each with a different asphalt binder content. Then, by evaluating each trial blend’s performance, an optimum asphalt binder content can be selected. In order for this concept to work, the trial blends must contain a range of asphalt contents both above and below the optimum asphalt content. This can be accomplished by either of two ways:
- Select the asphalt binder content for each trial blend from a predetermined list. Many agencies have predetermined lists that specify the asphalt content for each trial blend. It is assumed that the optimum asphalt binder content will lie within the range of specified trail blend values.
- Estimate the optimum asphalt binder content then select trail blends with asphalt binder contents at, above and below the estimated optimum content. One common estimation method is the centrifuge kerosene equivalent test (CKE), although this procedure has been discontinued by AASHTO (AASHTO, 2000a[4]).
Centrifuge Kerosene Equivalent (CKE) Test
The centrifuge kerosene equivalent (CKE) test, used to estimate optimum asphalt content, involves three basic steps (ASTM, 2000[5]; AASHTO, 2000[6]; Roberts et al., 1996[2]):
- Determine the centrifuge kerosene equivalent (CKE). A small fine aggregate sample (passing the 4.75 mm (No. 4) sieve) is first weighed then submerged in kerosene. Once the sample is saturated with kerosene it is placed in a centrifuge for 2 minutes to remove excess kerosene, then reweighed. The difference in these weights gives an estimate of the fine aggregate’s ability to absorb asphalt binder.
- Determine the coarse aggregate surface capacity. A small coarse aggregate sample (passing the 9.5 mm (0.375 inch) sieve but retained on the 4.75 mm (No. 4) sieve) is first weighed then submerged in SAE 10 oil for 5 minutes. The sample is then drained and placed in an oven for 15 minutes after which it is reweighed. The difference in these weights gives an estimate of the coarse aggregate’s ability to absorb asphalt binder.
- Estimate the optimum asphalt content. Results from the first two steps are corrected for aggregate specific gravity then entered on a chart to determine the percent oil recommended for an asphalt cutback (specific cutback types referenced are RC-250, MC-250 and SC-250). This percent oil is then corrected for the increased viscosity of the HMA asphalt binder used.
The standard CKE tests are:
- AASHTO T 270: Centrifuge Kerosene Equivalent and Approximate Bitumen Ratio (Discontinued)
- ASTM D 5148: Centrifuge Kerosene Equivalent
Sample Asphalt Binder Contents
Based on the results of the CKE test, samples are typically prepared with the following asphalt binder contents (Roberts et al., 1996[2]):
- The value determined by the CKE test
- 0.5, 1.0, 1.5 and 2.0 percent above the CKE value (at least one set of specimens should have enough asphalt binder to flush after compaction)
- 0.5 and 1.0 percent below the CKE value
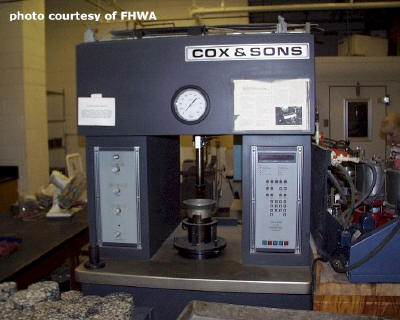
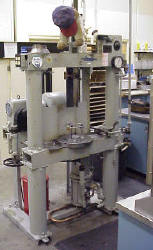
Compaction with the California Kneading Compactor
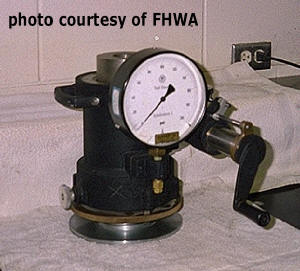
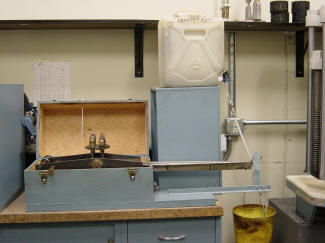
Each sample is then heated to the anticipated compaction temperature and compacted with the California kneading compactor (Figure 1 and 2), a device that applies pressure to a sample through a hydraulically operated tamper foot. Key parameters of the California kneading compactor are:
- Sample size = 102 mm (4-inch) diameter cylinder approximately 64 mm (2.5 inches) in height (corrections can be made for different sample heights)
- Tamper foot = Shield-shaped with an area of 20 cm2 (3.1 in2)
- Compaction pressure = Ranges from 2.4 to 3.4 MPa (350 to 500 psi)
- Number of blows = 150 (plus any preparatory blows at 1.7 MPa (250 psi) )
- Simulation method = The tamper foot strikes the sample on the top near the edge. The base rotates 1/6 of a revolution after each blow. This helps achieve a sample particle orientation that is somewhat like that achieved in the field after roller compaction.
|
|
|
The standard kneading compactor sample preparation procedure is:
- AASHTO T 247 and ASTM D 1561: Preparation of Test Specimens of Bituminous Mixtures by Means of the California Kneading Compactor
The Hveem Stabilometer and Cohesiometer
The Hveem stabilometer (Figure 3) provides the key performance prediction measure for the Hveem mix design method (TRB, 2000[7]). The stabilometer measures the resistance to deformation of a compacted HMA sample by measuring the lateral pressure developed from applying a vertical load (AASHTO, 2000[6]). The cohesiometer then measures the cohesion of the same compacted HMA sample by measuring the forces required to break or bend the sample as a cantilevered beam (AASHTO, 2000[6]).
Hveem Stabilometer
The stabilometer (Figure 3), a closed-system triaxial test, applies an increasing load to the top of the sample at a predetermined rate. As the load increases, the lateral pressure is read at specified intervals. The resulting stabilometer value is calculated as:
With this equation, the stabilometer value can range from 0 to 90. Zero would represent a condition where lateral pressure is equal to vertical pressure (e.g., a liquid). Ninety would represent a condition where there is no lateral pressure no matter what the vertical pressure is (e.g., an incompressible solid). Table 1 shows typical stabilometer criteria.
Table 1. Typical Hveem Design Criteria (from Asphalt Institute, 1979[8])
| Mix Criteria | Light Traffic (Less than 104 ESALs) |
Medium Traffic (104 - 106 ESALs) |
Heavy Traffic (Greater than 106 ESALs) |
|---|---|---|---|
| Stabilometer Value | 30 | 35 | 37 |
| Air Voids | Approximately 4 percent | ||
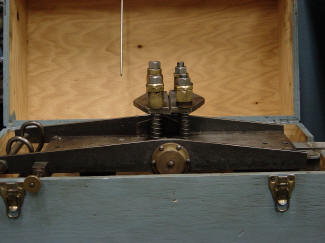
Hveem Cohesiometer
The cohesiometer (Figures 4 and 5) attempts to measure cohesive strength across the diameter of a sample on which the stability test had already been conducted. This is intended to provide some prediction about the ability of the HMA sample to resist raveling under traffic loading. Basically the sample is bent as a cantilevered beam until it fails. Although it was useful for oil mixes, HMAs tend to have large cohesion values as measured by the cohesiometer and rarely, if ever, fail. As a result, the cohesiometer has fallen out of favor and is rarely used (Roberts et al., 1996[2]).
|
|
|
Density and Voids Analysis
All mix design methods use density and voids to determine basic HMA physical characteristics. Two different measures of densities are typically taken:
- Bulk specific gravity (Gmb).
- Theoretical maximum specific gravity (TMD, Gmm).
These densities are then used to calculate the volumetric parameters of the HMA. Measured void expressions are usually:
- Air voids (Va), sometimes expressed as voids in the total mix (VTM)
- Voids in the mineral aggregate (VMA)
- Voids filled with asphalt (VFA)
Generally, these values must meet local or State criteria.
Selection of Optimum Asphalt Binder Content
The optimum asphalt binder content is finally selected based on the combined results of the stabilometer test, density analysis and void analysis. As a first step, it is prudent to plot these test results versus asphalt binder content in order to check them for possible testing errors. Typically, these plots should exhibit the following characteristics:
- Hveem stability should decrease with increasing asphalt binder content.
- Density will generally increase with increasing asphalt content. The curve may or may not reach a maximum.
- Percent air voids should decrease with increasing asphalt content.
Recall that the Hveem mix design method strives to select the asphalt content resulting in the highest durability without falling below a minimum allowable stability. The “pyramid” method is a common method of selecting the optimum asphalt binder content (Figure 6).
- Evolution of the Hveem Stabilometer Method of Designing Asphalt Paving Mixtures. Asphalt Paving Technology: Proceedings, vol. 54. Association of Asphalt Paving Technologists Technical Sessions, 11-13 February 1985. San Antonio, TX. pp. 243-265.↵
- Hot Mix Asphalt Materials, Mixture Design, and Construction. National Asphalt Pavement Association Education Foundation. Lanham, MD.↵
- Mix Design Methods for Asphalt, 6th ed., MS-02. Asphalt Institute. Lexington, KY.↵
- Standard Specifications for Transportation Materials and Methods of Sampling and Testing, Twentieth Edition. American Association of State Highway and Transportation Officials. Washington, D.C.↵
- Annual Book of ASTM Standards, Section four: Construction. Vol. 4.03. American Society for Testing and Materials. West Conshohocken, PA.↵
- American Association of State Highway and Transportation Officials (AASHTO). (2000a). Standard Specifications for Transportation Materials and Methods of Sampling and Testing, Twentieth Edition. American Association of State Highway and Transportation Officials. Washington, D.C.↵
- Hot-Mix Asphalt Paving Handbook 2000. Transportation Research Board, National Research Council. Washington, D.C.↵
- Mix Design Methods for Asphalt Concrete and Other Hot-Mix Types. Manual Series No. 2 (MS-2). Asphalt Institute. Lexington, KY.↵