Overview
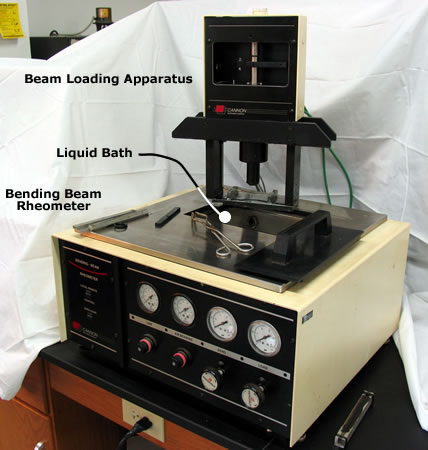
The Bending Beam Rheometer (BBR) test (see Figure 1) provides a measure of low temperature stiffness and relaxation properties of asphalt binders. These parameters give an indication of an asphalt binder’s ability to resist low temperature cracking. The BBR is used in combination with the DTT to determine an asphalt binder’s low temperature PG grade. As with other Superpave binder tests, the actual temperatures anticipated in the area where the asphalt binder will be placed determine the test temperatures used.
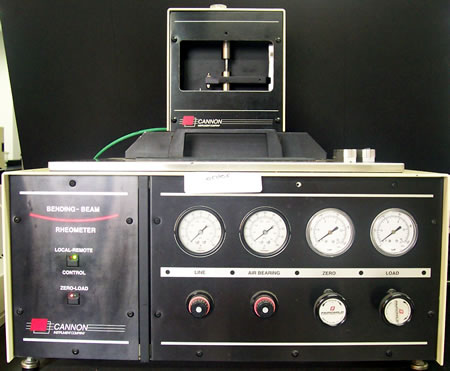
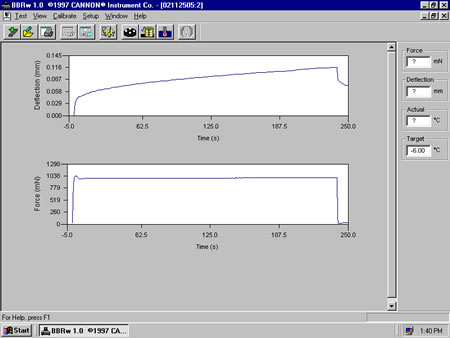
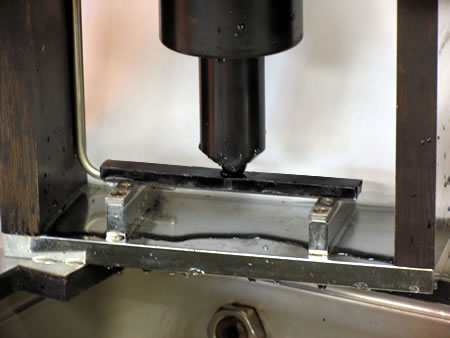
The basic BBR test uses a small asphalt beam that is simply supported (Figure 2) and emersed in a cold liquid bath . A load is applied to the center of the beam and its deflection is measured against time (Figure 3). Stiffness is calculated based on measured deflection and standard beam properties and a measure of how the asphalt binder relaxes the load induced stresses is also measured. BBR tests are conducted on PAV aged asphalt binder samples. The test is largely software controlled.
The standard BBR test is:
- AASHTO T 313: Determining the Flexural Creep Stiffness of Asphalt Binder Using the Bending Beam Rheometer (BBR)
The Superpave PG binder specification involving the BBR is:
- AASHTO PP 42: Determination of Low-Temperature Performance Grade (PG) of Asphalt Binders
Background
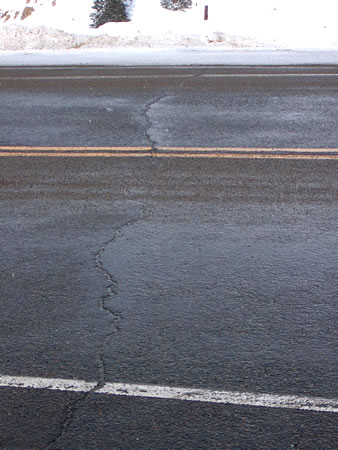
As surrounding temperatures drop, pavements contract and build up internal stresses. If this contraction occurs fast enough the pavement may crack because it does not have time to relax these stresses. This type of crack, typically called a “thermal crack”, or transverse crack (because of the direction of cracking in relation to the direction of traffic) (Figure 4) can result from either of two related mechanisms:
- Single thermal cycle below the critical temperature. A single severe drop in temperature that causes stress to quickly build up to a critical point that causes cracking. This is called “single-event low temperature cracking” and the particular temperature associated with these critical stresses is called the “critical temperature”.
- Thermal cycling above the critical temperature. Repeated thermal contraction and expansion that occurs above the critical temperature can cause stresses to build up and eventually cause cracking.Figure 4: Thermal crack.
In both cases, the failure mechanism is essentially the same: thermal shrinkage initiates and propagates flaws or cracks in the asphalt binder portion of the HMA (Anderson and Dongre, 1995[1]).
The BBR is a test designed to measure this stiffness and the rate of stress relaxation. Asphalt binders that are not too stiff at low temperatures and able to relax built up stresses are desirable. Results from the BBR are combined with results from the DTT to determine an asphalt binder’s critical cracking temperature and PG low temperature grade.
BBR Superpave Specification Logic
The BBR test is used to determine an asphalt binder’s creep stiffness as a function of time. These data can be converted to a stress relaxation modulus, which is then multiplied by a constant to predict the thermal stress produced in a HMA pavement using the constituent asphalt binder. This calculated thermal stress is then compared to a failure stress determined using the DTT to produce a critical cracking temperature of the pavement.
Sample Aging
Because low temperature cracking is a phenomenon found mostly in older pavements, the test is run on the long-term aged residue from the PAV.
Master Stiffness Curve (Figure 5)
Creep stiffness is a measure of the thermal stresses in the asphalt binder resulting from thermal contraction. If these stresses are too great, cracking will occur. A higher creep stiffness value indicates higher thermal stresses.
Creep stiffness is calculated using standard beam theory. The equation used is:
![]()
Where:
S(t) = asphalt binder stiffness at a specific time
P = applied constant load (100 g or 0.98 N)
L = distance between beam supports (102 mm)b = beam width (12.5 mm)
h = beam thickness (6.25 mm)
δ(t) = deflection at a specific time
This equation is the standard beam equation used for determining deflection with the stiffness and deflection terms switched. In a viscoelastic material such as asphalt binder, and to an extent all materials, the stiffness and resulting deflection are time dependent, thus they are both written as a function of time.
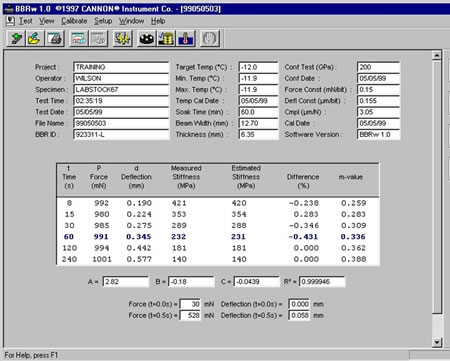
In order to determine the stress relaxation properties of an asphalt binder, creep stiffness calculations are made at 8, 15, 30, 60, 120 and 240 seconds of loading. These times were chosen because they are about equally spaced on a logarithmic time scale (Figure 5). For each time, the asphalt binder creep stiffness is calculated and plotted. A curve, called the master stiffness curve, is then fit to these points and is of the form:
![]()
Where:
S(t) = asphalt binder stiffness
t = time
A, B, C = empirically determined constants
The slope of this master stiffness curve, designated by the letter “m”, is a measure of the rate at which the asphalt binder relieves stress through plastic flow.
Superseded Reporting Method
This section briefly describes the original reporting method for the BBR. This method has been superseded.
Originally, the key reporting values were creep stiffness at 60 seconds and the slope of the master stiffness curve at 60 seconds (commonly called the “m-value”).
There were specific reasons for measuring the deflection at 60 seconds. When the BBR test was originally developed, most data that correlated thermal cracking of in-service HMA pavements with asphalt binder stiffness used loading times of 1 to 5.5 hours. From this, a limiting stiffness based on 2 hours of loading was selected as the specification target. Unfortunately, 2 hours was considered too long for a standard laboratory test so the time-temperature superposition principle was used to shorten test time. This principle basically allows test results from a shorter loading time using one or more temperatures to be used to estimate the test results at a longer loading time. Testing showed that for most asphalt binders, if the test temperature were increased by 18°F (10°C) the BBR stiffness at 60 seconds loading time could be equated to the asphalt binder stiffness at 2 hours in the field at the low temperature specification. Therefore, the BBR test takes 60 seconds and is conducted at a temperature 18°F (10°C) higher than the low temperature specification. Thus, for a PG 64-22 asphalt binder, the test temperature would be 10°F (-12°C), which is 18°F (10°C) higher than the low temperature specification of of -7.6°F (-22°C).
Since a higher creep stiffness value indicates higher thermal stresses, a maximum creep stiffness value (300 MPa) was specified.
Since a lower m-value indicates a lesser ability to relax stresses, a minimum m-value (0.300) was specified.
Test Description
The following description is a brief summary of the test. It is not a complete procedure and should not be used to perform the test. The complete BBR test procedure can be found in:
- AASHTO T 313: Determining the Flexural Creep Stiffness of Asphalt Binder Using the Bending Beam Rheometer (BBR)
Summary
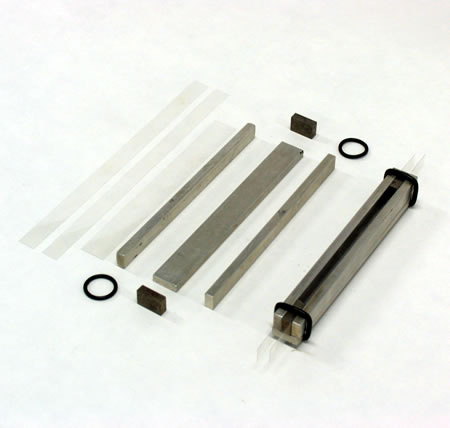
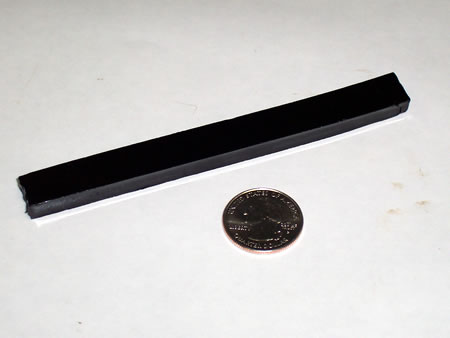
A sample of asphalt binder is molded into a beam measuring 0.246 x 0.492 x 5.000 inches (6.25 x 12.5 x 127 mm) (Figure 6). This sample is then simply supported at two points 4.02 inches (102 mm) apart in a controlled temperature fluid bath. The beam is then loaded at the midpoint by a 0.22 lb (100 g) load that, under normal gravity conditions, produces 0.22 lb (0.98 N) of force. The beam deflection is measured at 8, 15, 30, 60, 120 and 240 seconds. Beam stiffness, often called “creep stiffness”, is calculated for these times. A stiffness master curve is then fitted to these points. The BBR test is done on two beam samples. Figure 7 shows the major BBR equipment.
Approximate Test Time
3 hours (from sample preparation to end of test).
Basic Procedure
- Set the BBR fluid bath to the desired test temperature. The fluid should be clear at all test temperatures. Suitable fluids are ethanol, methanol and glycol-methanol mixtures. The specific gravity of the fluid should be less than 0.0655 lb/ft3 (1.05 kg/m3) to prevent the asphalt binder beam from floating.
- Heat long term aged (PAV) asphalt binder until fluid enough to pour. During heating the sample should be covered and occasionally stirred to ensure homogeneity.
- Stir the heated sample to remove air bubbles and pour into two aluminum BBR molds (see Figure 8), making sure to overpour so that there is excess sample along the top of the mold (Video 1). This overpouring will ensure enough asphalt binder to completely fill the mold.
Video 1: Pouring a BBR sample.
All testing should be completed within four hours (AASHTO, 2000c[2]).
- Allow molds to cool for 45 to 60 minutes at room temperature, then trim the top of sample flush with mold using a hot spatula.
- To demold samples, cool mold in an ice bath or freezer at -5°C for 5 to 10 minutes; just long enough that the beam can be easily removed from the mold without damaging it.
- Place beams in the BBR bath at test temperature for 60 minutes to condition them.
- Place the test beam on the test supports (see Figure 2).
- To ensure that the loading head and the beam remain in contact for the entire test, manually apply a 0.008 lb (35 mN) contact load for no more than 10 seconds.
- Activate the automatic testing system. This system does the following:
- Apply a (0.22 lb) 980 mN seating load for 1.0 second.
- Reduce the seating load to 0.008 lb (35 mN) and allow the beam to recover for 20 seconds.
- Apply the 0.22 lb (980 mN) test load and maintain the load constant for 240 seconds. During this period, readings of deflection over time are recorded (Figure 9).
Results
Parameters Measured
- Creep stiffness (S) at 8, 15, 30, 60, 120, and 240 seconds
- m-value, at 8, 15, 30, 60, 120, and 240 seconds
The R2 goodness of fit parameter for the master stiffness curve is also reported.
Specifications
The performance graded asphalt binder specification involving the BBR is:
- AASHTO PP 42: Determination of Low-Temperature Performance Grade (PG) of Asphalt Binders
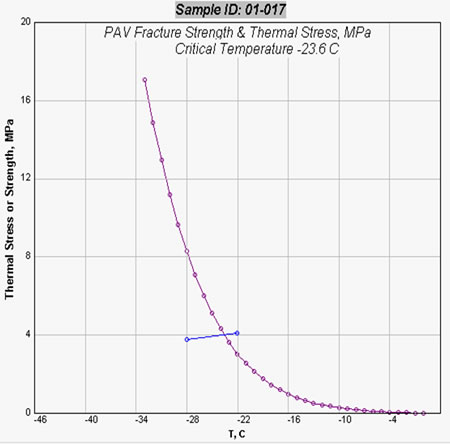
This procedure combines BBR and DTT test results to determine the low temperature asphalt binder grade by the following steps (Figure 10):
- Calculate the stiffness master curve from BBR test data.
- Create the creep compliance curve by taking the inverse of the stiffness master curve.
- Convert the creep compliance curve to a relaxation modulus. This is a fairly involved and numerically complex conversion.
- Calculate the thermal stress. This is also a fairly involved and numerically complex conversion.
- Multiply the calculated thermal stress by a “pavement constant” (chosen through research as 18). This pavement constant converts the laboratory-determined thermal stress to an equivalent field cracking temperature.
- Compare this calculated thermal stress to the failure stress from the DTT.
- When initially grading an asphalt binder, two DTT test temperatures are used and a curve is drawn between these two temperatures (with just two points the curve is really just a line). The point at which this DTT curve intersects the BBR thermally induced stress curve is defined as the critical cracking temperature of a pavement that uses the tested asphalt binder.
- When prequalifying an asphalt binder for a specific PG grade, only one DDT test temperature is needed. If the DTT determined failure stress is above the BBR thermally induced stress curve then the binder passes the low temperature prequalification.
Figure 11 shows an actual plot of this data.
SUPERSEDED SPECIFICATIONS
This section shows the original performance graded asphalt binder specifications for the BBR. These specifications have been superseded.
| Material of concern | Value | Specification | HMA Distress |
|---|---|---|---|
| PAV residue | Creep stiffness at 60 s | ≤ 300 MPa (43.5 psi) | Low temperature cracking |
| PAV residue | m-value at 60 s | ≥ 0.300 | Low temperature cracking |
Typical Values
Figure 9 and Figure 12 show typical BBR output.
Calculations
BBR software performs the necessary calculations automatically. The BBR software uses the following equations:
Stiffness (see Interactive Equation)
Where:
S(t) = asphalt binder stiffness at a specific time
P = applied constant load (100 g or 0.98 N)
L = distance between beam supports (102 mm)
b = beam width (12.5 mm)
h = beam thickness (6.25 mm)
δ(t) = deflection at a specific time
Stiffness Master Curve
Where:
S(t) = asphalt binder stiffness
t = time
A, B, C = empirically determined constants
- Anderson, D.A. and Dongre, R. (1995). The SHRP Direct Tension Specification Test – Its Development and Use. <em>Physical Properties of Asphalt Cement Binders, </em>J.C. Hardin, Ed. ASTM Special Technical Publication 1241. American Society for Testing and Materials, Philadelphia, PA. pp. 51-66.↵
- American Association of State Highway and Transportation Officials (AASHTO). (2000c). <em>AASHTO Provisional Standards, April 2000 Edition</em>. American Association of State Highway and Transportation Officials. Washington, D.C.↵

